Adding Flowcharts
Often when you are documenting procedures, you will find that a simple sequence of steps is not enough. Often this is because there are decisions that need to be made, and you will need to show the flow through those decision points.
This is why we offer a flowchart feature in the editor, that allows you to create simple graphs that show the flow of procedures from one step to the next.
The flowchart will always move from top to bottom, to make sure it fits well into a document and can be printed.
To insert a flowchart, click the flowchart button in the editor toolbar: 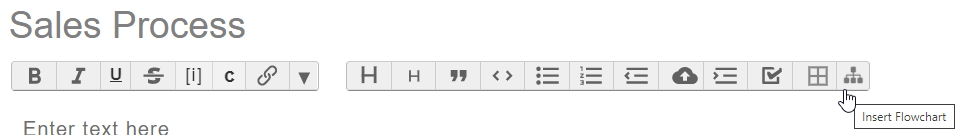
This will pop-up the flowchart editor. 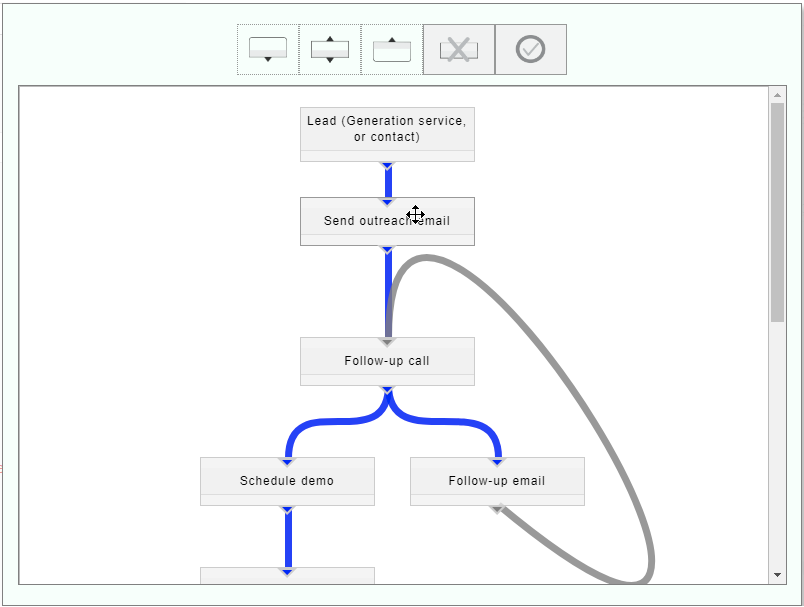
The first three buttons at the top represent the three types of elements you can add into the flowchart: a start point, a continuation point, and an end point. Simply drag these boxes onto the chart to add them.
Once you drag the box onto the chart, a textbox will appear at the top where you can enter in the label for the element.
You will also notice a triangular connector at the top, bottom or both. Drag this connector from one box to another's connector in order to link them up.
If you drag a connector above a box, it will show as gray to indicate it is going back in the flow.
To delete a box, click it and then click the X in the toolbar.
Once you are done, click the circular checkmark to save and close the editor. To edit the flowchart again, simply click it once (to set focus) and again to edit it.
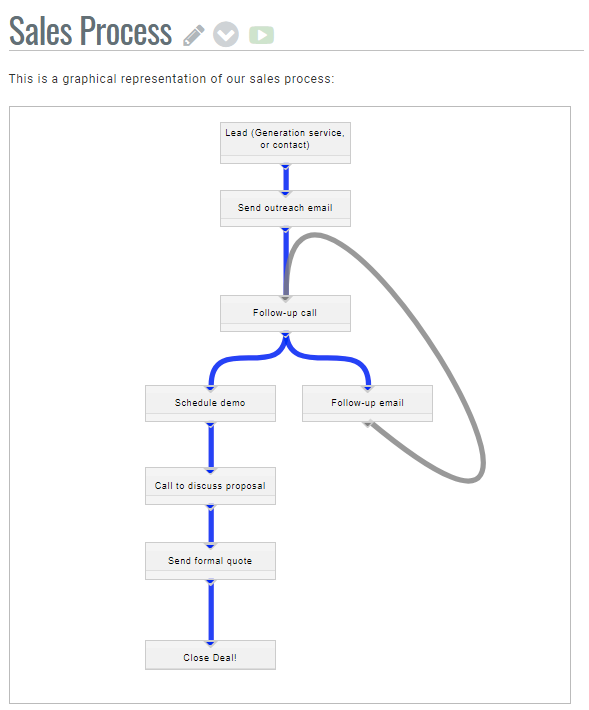
After you publish, the flowchart will appear in your article like an image: